Compliance Automation and Beyond: A Data Journey With Drata
VP of Data, Lior Solomon, walks us through his high-level plan to build a stellar data organization and cement a data-driven culture at Drata. Read all about his process and the tech partners that will help the data team reach their goals.

After my time as the VP of Data at Vimeo, where I was fortunate to lead the growth of a data engineering organization from a small team of five to 50 employees, while navigating the unique challenges posed by the pandemic and supporting the global growth of video adoption, the company was able to achieve the incredible milestone of becoming a public traded one.
I am proud to have had the opportunity to work with such a talented and dedicated team, who were instrumental in the success of the organization. With their support and hard work, we were able to accomplish our goals and deliver meaningful impact to the business. With these achievements in mind, I am now grateful to be taking on a new challenge for the past nine months, where I can continue to learn and grow while applying the experiences gained at Vimeo to the fastest growing compliance automation company in the world.
I joined Drata in May 2022 as the VP of Data, where I am building a data organization, utilizing cutting-edge modern technology stacks, enabling a data-driven culture, and influencing a topic of paramount importance to me: user data privacy. At Drata, we are working to make compliance effortless and accessible to companies of all sizes, and I’m excited to be a part of this innovative and ambitious endeavor.
I thought it would be a fun project to document my journey and share it with the world.
Here is an overview of my approach to getting my rocket ship data practice off the ground:
Identifying my key stakeholders
Defining our goals
Building a data team
Creating a data architecture and picking the stack
Establishing data governance
Measuring success
1. Identifying My Key Stakeholders
Identifying the key stakeholders in Drata that will benefit from data was my first step in this journey. This includes executives, business unit leaders, customer success managers, product managers, account execs, and revenue operation and data analysts. I’ve worked closely with these stakeholders to understand their needs and how data can help them achieve their objectives.
2. Defining Our Goals
In defining my goals for my data practice, I split them into short-term and long-term objectives based on the level of effort required to achieve them. For the short-term goals, I focused on objectives that could be accomplished relatively quickly and with less effort. This included areas requiring more descriptive analytics. These short-term goals were meant to provide quick wins for the business and improve its overall performance.
For the long-term goals, I identified objectives that required more extensive planning and effort. These goals will require predictive analytics which will be achieved over a longer period of time. In the short term, I wanted to make sure I influence the following areas:
Customer Onboarding Experience
The onboarding experience is a pivotal moment for new customers. A positive onboarding experience can set the tone for a long-term relationship, while a negative experience can lead to frustration and swift churn.
Drata’s outstanding 5-star ranking on G2, with an impressive 373 reviews, speaks to the exceptional customer experience that the platform provides and the high level of satisfaction they feel with Drata’s product. By prioritizing the customer onboarding experience, we're building on this foundation of excellence and ensuring that every new customer has the same positive experience that led to Drata’s stellar reputation. The following goal was designed and implemented together with our VP of Customer Success.
One of the first projects we engaged with was the customer success engagement dashboard. The CS team uses the dashboard to monitor and track the level of customer engagement with a product or service. It provides a visual representation of key performance indicators (KPIs) that measure customer engagement, including usage metrics, customer feedback, and customer satisfaction scores.
The CS engagement dashboard tracks the level of engagement of new customers during the onboarding process. This allows us to identify areas where customers are struggling or experiencing friction and make data-driven decisions to improve the onboarding experience.
Go-to-Market Scorecard
The GTM scorecard allows us to track the effectiveness of our GTM strategy and measure the success of our efforts. By defining the metrics and KPIs that matter to our business, we can gain visibility into how well our GTM strategy is working and identify areas for improvement. By collecting and analyzing data through the GTM scorecard, we can make informed decisions about our GTM strategy. This includes identifying the most effective marketing channels, understanding customer acquisition costs, and optimizing conversion rates. By using data to drive decision-making, we can make smarter choices that drive growth and profitability.
Previously, the GTM scorecard existed as a manual reporting process generated by the RevOps team. Working together with the RevOps team, we’ve begun automating this process and collaborating with the rest of the departments to track our targets vs. actual results.
Marketing Demand Generation
Demand generation is a key driver of customer acquisition. Marketing strategies such as content marketing, social media, and paid advertising helps us attract new customers and build a pipeline of potential leads. By tracking and analyzing the results of our demand generation efforts, we can identify what is working and what needs improvement. By using data to optimize our marketing campaigns, we can increase efficiency, reduce costs, and improve overall results.
All those best practices were dictated by the marketing team and designed by our VP of Product. Our immediate goal was to fully automate the process to report and monitor these outcomes.
In the long term, I am looking to influence the following areas:
Product North Star
A product north star is a high-level goal that defines the vision and direction for the product. It provides a clear understanding of what the product is and what it is trying to achieve. Having a north star can help align everyone in the company to the same vision and help everyone work towards achieving that goal.
By having a clear and compelling north star, we can create a competitive advantage for our product. A well-defined north star can help differentiate your product from the competition and position it as a leader in the market. This goal was identified and guided closely with our VP of Product.
Achieving Operational Efficiency
Achieving operational efficiency is a key long-term objective for any fast-growing SAAS company. By streamlining processes and leveraging automation technologies, you can reduce costs, increase efficiency, and deliver better customer service. This could involve initiatives such as automating customer support, streamlining billing processes, and optimizing resource allocation.
These goals will help me determine what data I need to collect, how to analyze it, and eventually, design the technical architecture and stack.
3. Building a Data Team
Once I had my goals lined up, the next step was to plan my team hiring plan. I need a team of professionals with a range of skills to build and run my data practice. This could include analytics engineers, data analysts, data scientists, data engineers, and data architects. Based on the company’s size, I wanted to start with a small centralized team that can carry together end-to-end our short-term goals.
Knowing it may take a while to hire a data leader and a team, my CTO and Co-Founder Daniel Marashlian reached out to Data Clymer, a next-generation data consultancy firm that provides trusted, full-stack cloud data and analytic solutions to enable data-driven companies. Their team of certified data engineering and analytics experts offers highly-personalized service to clients. They specialize in data strategy, custom data connectors, health checks, and tune-ups. Data Clymer offers an instant data team that clients can use on-demand for their projects.
While getting fantastic air coverage from the Data Clymer team, I quickly partnered with our amazing talent team, came up with an interview process, and hired a stellar team to help us build our core infrastructure.
4. Creating a Data Architecture
Creating a data architecture is an essential step for any fast-growing startup, and can help to ensure that your data is organized, accessible, and secure. When defining your data architecture, it’s important to consider the technology stack, data sources, and data storage that will be used to support your business.
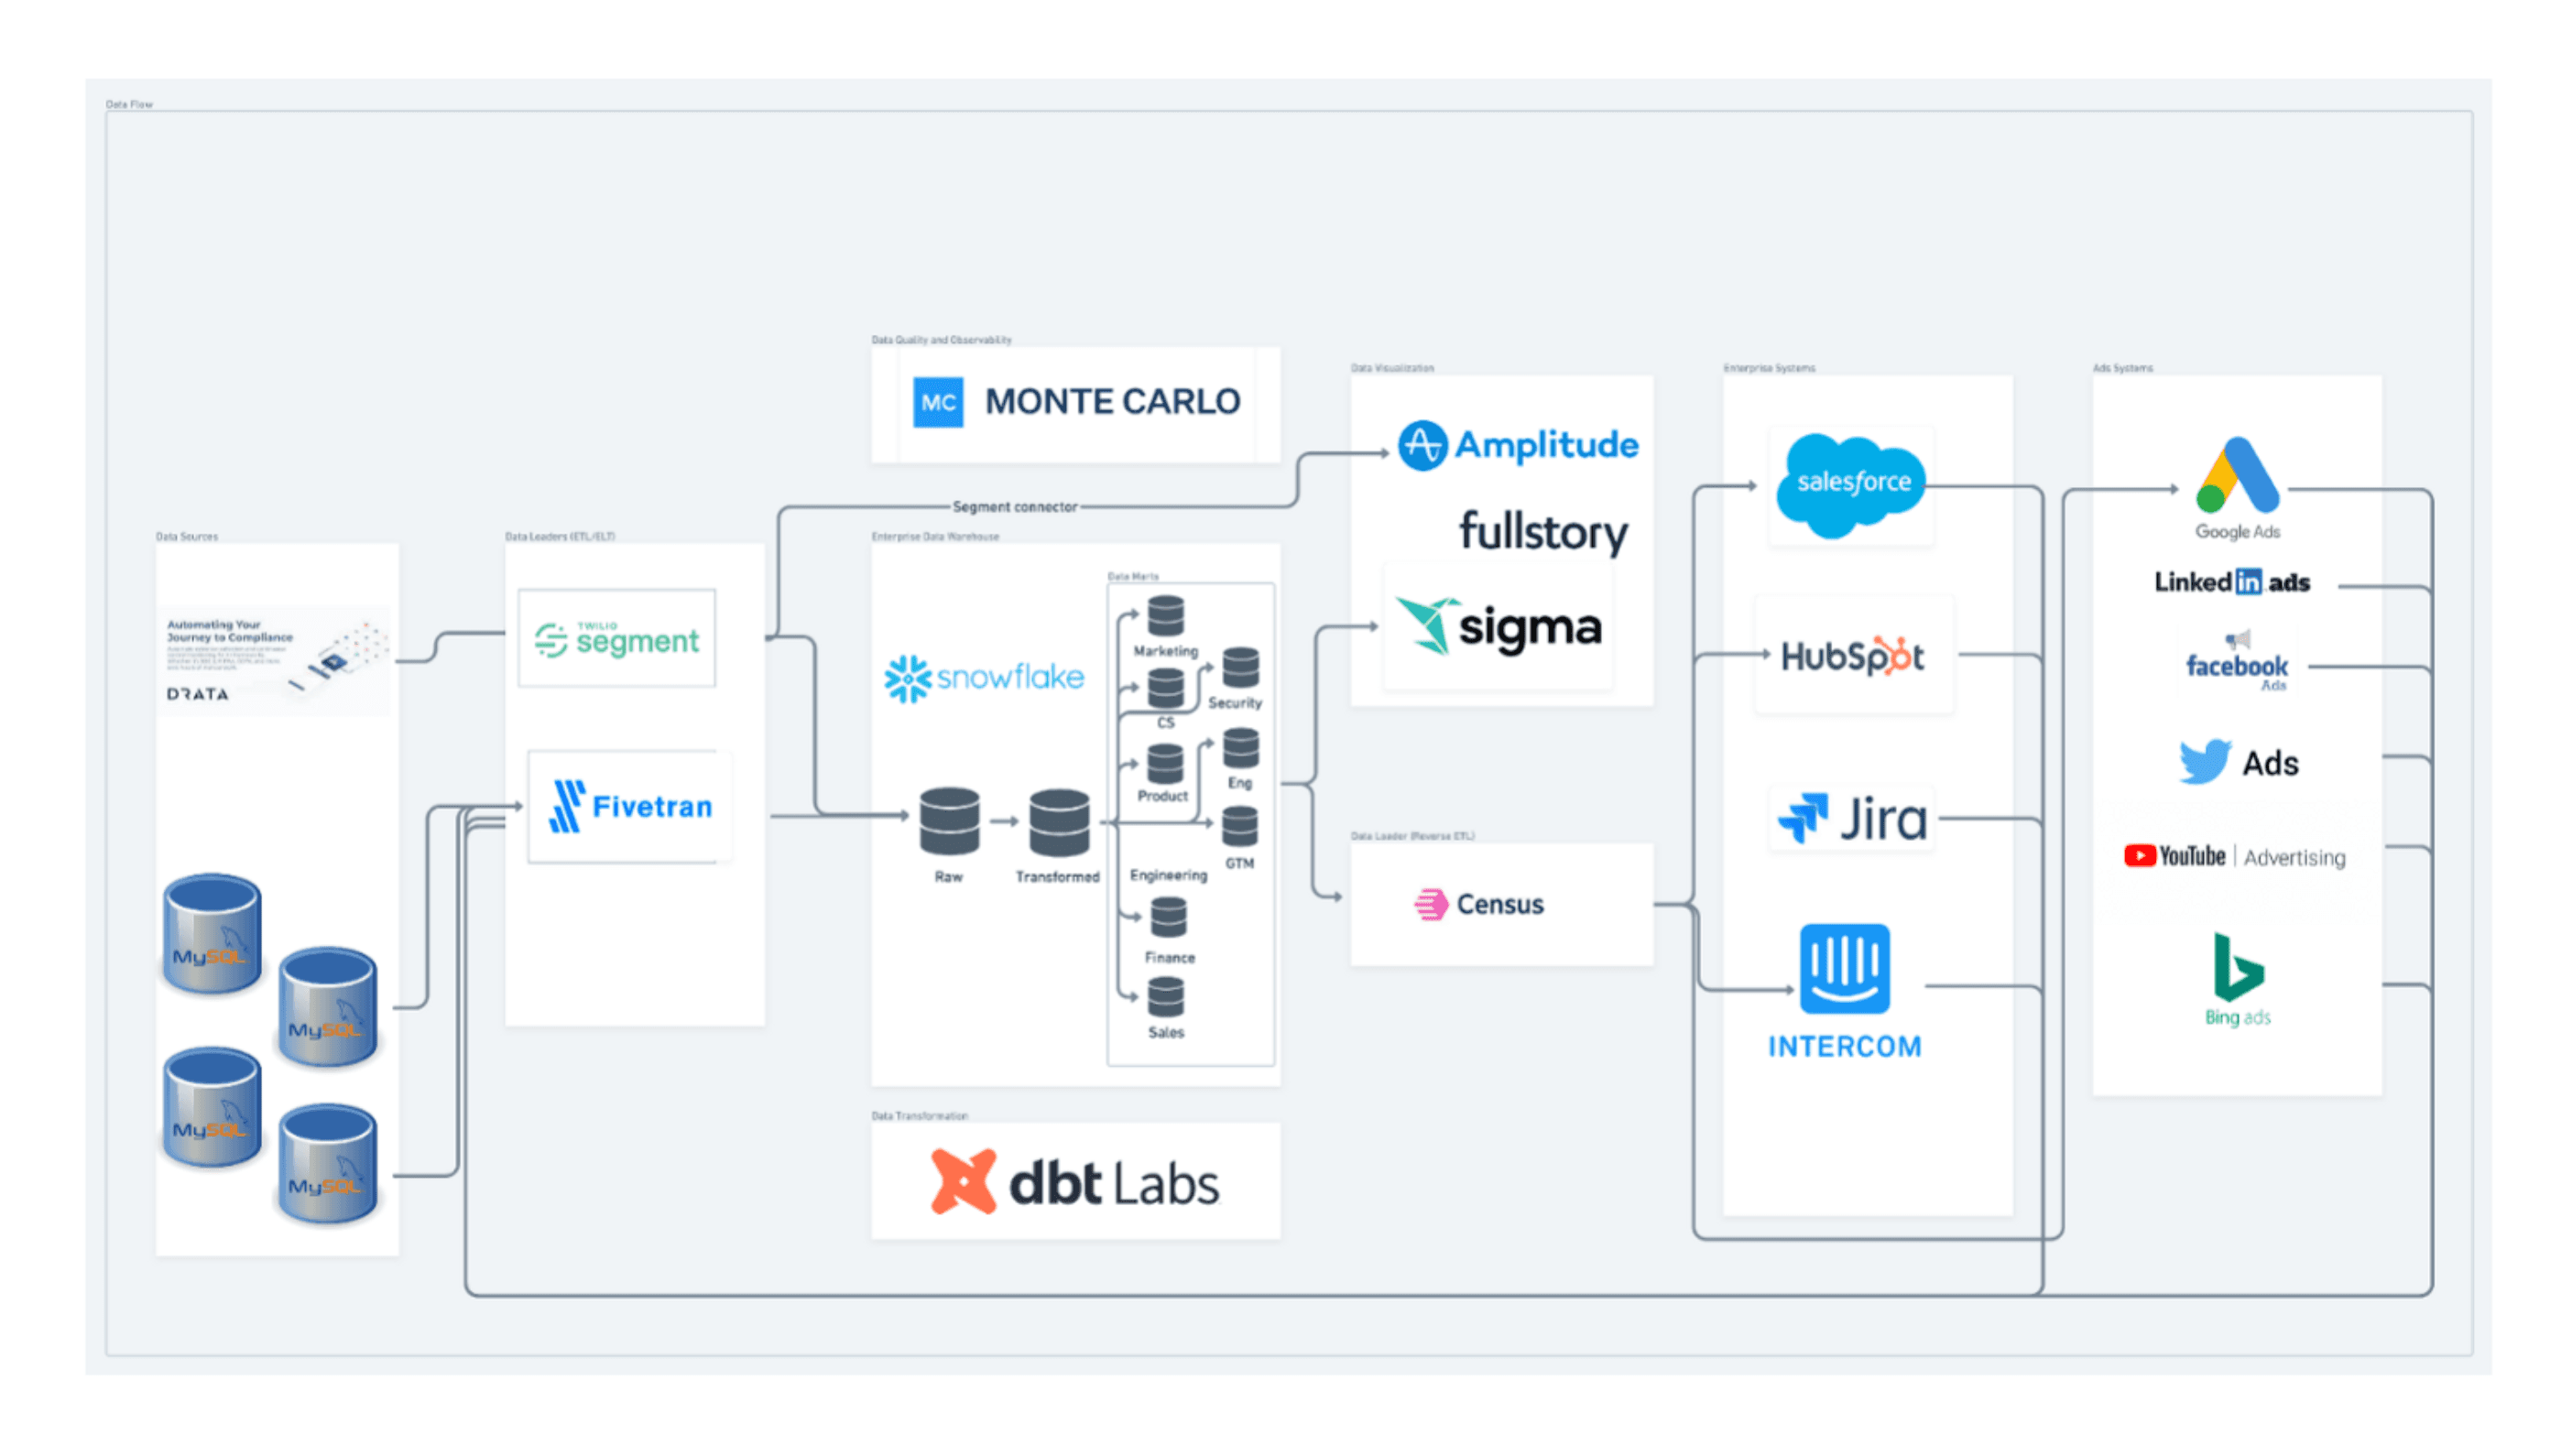
Choosing the right technology stack is critical for a fast-growing startup. I wanted to select technologies that would scale with our fast-growing business, be easy to use, and seamlessly integrate with our existing systems.
Data Warehouse
The first decision we had to make was our data warehouse, which we ended up going with Snowflake. Here are some of the pros and cons we have considered taking this decision. Please bear in mind that I won’t go in technical depth, I just want to highlight the general thought process:
Pros:
Scalability: Snowflake is designed to scale with your business, allowing you to store and analyze large volumes of data as your company grows.
Performance: Snowflake is known for its high performance, allowing you to query large data sets quickly and efficiently.
Cloud-native: Snowflake is a cloud-native data warehouse, meaning that it is designed to run on cloud infrastructure such as Amazon Web Services, Microsoft Azure, or Google Cloud Platform. This can offer significant advantages in terms of flexibility, scalability, and cost-effectiveness when picking a cloud provider.
Ease of use: Snowflake is easy to use and does not require complex setup or maintenance, which can save your team valuable time and resources.
Security: Snowflake is built with advanced security features that can help keep your data safe and secure, including features such as encryption, access controls, and compliance with industry standards.
Cons:
Cost: Snowflake can be more expensive than other data warehouses, particularly if you have a large amount of data to store and analyze. However, the pay-as-you-go pricing model can help to manage costs more effectively.
Overall, Snowflake is a powerful and flexible data warehouse that can offer significant advantages for a fast-growing startup. However, it’s important to carefully consider the pros and cons to determine the right solution for your business.
ELT (Extract, Load, Transform)
Next, I had to consider the data sources that will be used to populate my data architecture and ingested into the centralized enterprise data warehouse we were building. These might include internal sources such as customer data, sales data, or financial data, as well as external sources such as social media data, market research data, or third-party data sources.
At Drata, we are using a single-tenant architecture as a database deployment model, meaning each customer is provided with their own dedicated instance of the database. In a MySQL-based single-tenant architecture, each customer would have a dedicated MySQL database instance. This approach provides greater control over data privacy and security, as well as better performance and scalability compared to multi-tenant architectures, where multiple customers share the same database instance.
However, single-tenant architectures can be more complex and expensive to manage, as each customer requires their own dedicated resources and infrastructure. This constraint made us thoroughly test the ELT tool we picked to load all the data sources from all the supported systems into Snowflake.
Once we figured out our ELT tool and had all our data ingested to our data warehouse, it was time to model the data in the data warehouse and do some transformations!
Transformation
For data transformation, there are several reasons why you might want to use dbt (Data Build Tool) as part of your data analytics stack:
Version control: dbt allows you to version control your SQL code, enabling you to easily track changes and collaborate with other team members through GitHub integration.
Data transformation: dbt provides a range of data transformation capabilities, including joins, filtering, aggregations, and pivoting, making it easier to work with complex data sets. Not to mention a vast open-source library of packages for more advanced functions.
Testing: dbt allows you to write tests for your data models, ensuring that they are working as expected and providing a high level of data quality.
Documentation: dbt provides automatic documentation generation for your data models, making it easier to understand how data is flowing through your system and how it is being transformed.
Modularity: dbt enables you to break down your data models into modular, reusable pieces, making it easier to maintain and update your data analytics stack as your business needs change.
Collaboration: dbt enables you to collaborate with other team members on data modeling and transformation projects, providing a high level of transparency and accountability.
Overall, dbt can help to streamline your data analytics processes, improve data quality, and facilitate cross-functional collaboration. If you’re looking to build a scalable, efficient, and collaborative data analytics stack, dbt is definitely worth considering.
I won’t get into the details of the data modeling strategy we picked, we will discuss this in a separate blog post.
Reverse ETL
Reverse ETL is a technology that enables you to push data from your data warehouse to other applications or systems rather than pulling data from those systems into your data warehouse. This can be useful in several scenarios, such as when you need to update customer records in your CRM based on changes to your data warehouse. Reverse ETL can help to improve data quality, reduce data latency, and streamline your data analytics processes.
We chose Census as our Reverse ETL tool to activate the Customer 360 data stored in Snowflake. Data Activation makes data actionable for business users and makes our data infrastructure investments more valuable. With Census, it’s easy to sync unified audiences to Google Ads, send churn risk users to Intercom, and enrich our GTM records in Salesforce.
BI Tool
Sigma Computing is a cloud-based analytics platform that enables users to analyze and visualize their data in a fast and flexible way. Here are a few reasons why we considered using Sigma Computing in our data analytics stack:
Empowers self-service analytics in a governed familiar UI: the spreadsheet.
Frees data and BI teams from managing an additional model on top of dbt.
Enables business users to freely drill down to row level data at massive scale.
Provides a collaborative environment for data analytics, enabling teams to work together on projects and to share insights and results in real time.
CSAT: 4.8. Real-time dedicated in-app support for your entire organization in minutes. 30-minute dedicated office hours over Zoom to all accounts
Overall, Sigma Computing is a powerful and flexible analytics platform that can help you analyze and visualize your data. If you’re looking for a cloud-based analytics solution that is easy to use, fast, and collaborative, Sigma Computing is definitely worth considering.
Data Observability
At Drata, trust is one of our core values. This means that data observability is critical for several reasons.
Firstly, as a compliance-focused company, it’s essential to ensure that your data is accurate, complete, and secure to maintain regulatory compliance and avoid costly penalties or legal action. Additionally, as a startup, you're likely handling large volumes of data from multiple sources, making it difficult to keep track of changes, anomalies, and errors without a robust data observability system in place.
With Monte Carlo’s data observability platform, you can detect and diagnose data quality issues in real time, reducing the risk of data breaches and ensuring that your data remains accurate and compliant with industry standards. This can help you identify and diagnose data quality issues, enabling you to improve data accuracy, reduce data downtime, and make better decisions based on high-quality data.
Here are a few reasons why you might consider using Monte Carlo in your data analytics stack:
Data observability: Monte Carlo provides data observability capabilities, which allow you to monitor and detect data quality issues in real time. This can help you quickly identify and diagnose data issues, and to take action to prevent them from impacting your business.
Automated monitoring: Monte Carlo provides automated monitoring of your data pipelines, enabling you to detect issues before they become critical. This can help to reduce data downtime and improve data quality.
Root cause analysis: Monte Carlo provides root cause analysis capabilities, which allow you to quickly identify the root cause of data quality issues. This can help you to take action to prevent similar issues from occurring in the future.
Collaborative: Monte Carlo provides a collaborative environment for data observability, enabling teams to work together on data quality issues and share insights and results in real time.
Easy integration: Monte Carlo can be easily integrated with your existing data analytics stack, including data warehouses, ETL tools, and BI platforms. This makes it easy to add data observability capabilities to your existing data analytics workflows.
Overall, Monte Carlo can help you to improve data quality, reduce data downtime, and make better decisions based on high-quality data. If you’re looking to improve data observability and data quality in your data analytics stack, Monte Carlo is definitely worth considering.
Overall, the data architecture we have put in place has been designed to support the specific needs and goals of our fast-growing startup. By choosing self-managed tools that don't require extensive infrastructure management, we have prioritized speed and business enablement over hands-on control and flexibility. This approach has allowed us to scale quickly and efficiently, while also maintaining a high level of data security and compliance.
While I’m confident that the decisions made regarding our data architecture and analytics stack will serve us well in the short-term, I’m also aware that as our team grows and our needs evolve, some of these tools and decisions may need to be revisited in the future.
5. Establishing Data Governance
Establishing data governance policies is essential to ensure that your data is collected, stored, and used in a way that is secure, compliant, and consistent with your business needs. Here are some key elements we have implemented as part of our data governance policies:
Data privacy and security: We have implemented data governance policies that outline how data is collected, stored, and secured to protect against data breaches, unauthorized access, and other security threats. This includes policies around data encryption, access controls, and data retention. I don’t think this bullet can ever be marked as done, it is a continuous process that we shall continuously iterate through and improve.
Data quality and consistency: We are working on defining the data governance policies to outline how data is defined, validated, and maintained to ensure accuracy and consistency. This includes policies around data validation, data cleaning, and data enrichment for our critical datasets. That is also an ongoing process that we continuously improve.
Data ownership and access: We clearly define who is responsible for data, who has access to it, and under what conditions. This includes policies around data ownership, data access, and data sharing.
Compliance with regulatory standards: We work closely with our compliance team to assure that the data governance policies ensure compliance with regulatory standards and industry best practices, such as GDPR, HIPAA, and SOC 2.
Monitoring and auditing: We have established monitoring and auditing processes to track data usage, identify potential security risks, and ensure compliance with data governance policies. We use dbt and Monte Carlo to identify lineage of data, anomaly detection and freshness issues.
6. Measuring Success
This is honestly one of the more challenging aspects of building a data team. Here are some common metrics that my data teams use to measure success:
Data accuracy: Data accuracy is a critical metric for measuring the success of a data team. This includes metrics like data completeness, consistency, and timeliness, as well as the level of data quality issues and how quickly those issues get resolved.
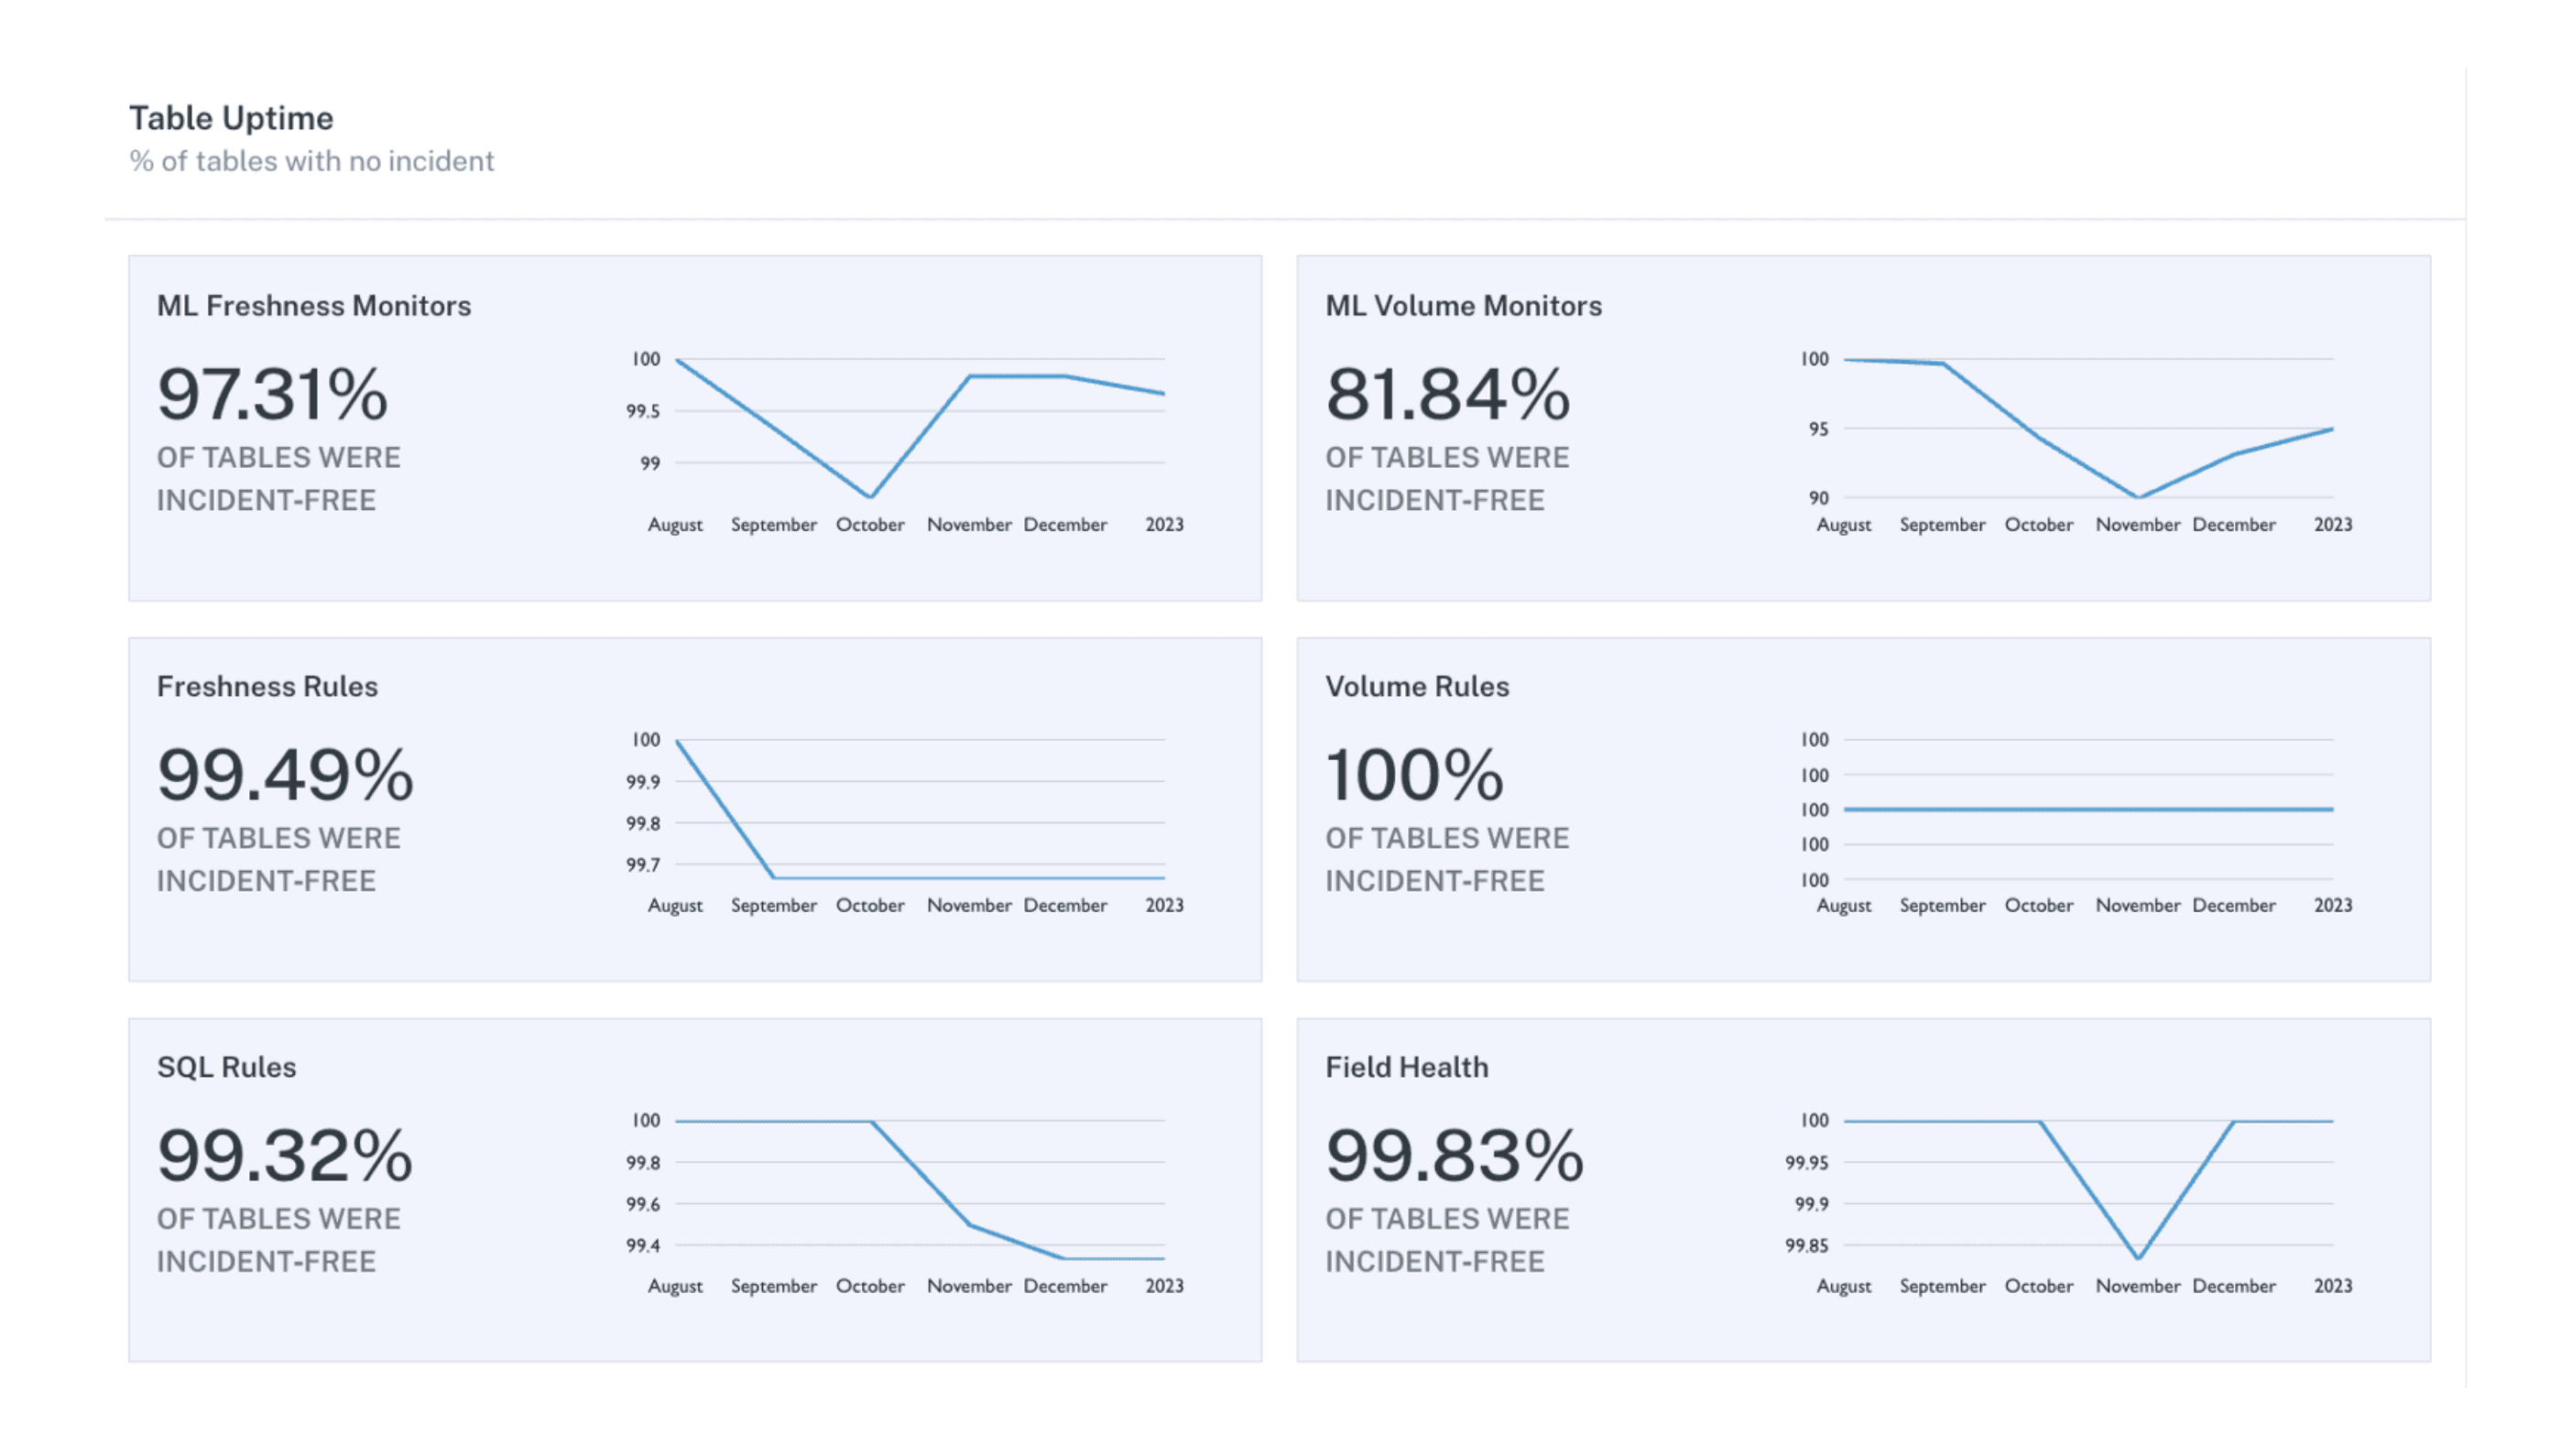
The following metrics are gathered by Monte Carlo.
Data usage: We measure the success of our work by the extent to which data is being used by the organization. This can include metrics like the number of data requests, the number of dashboards and reports created, and the level of user engagement with those dashboards and reports.
Business impact: The ultimate goal of a data team is to drive business value, and as such, business impact is an important metric for measuring success. This can include metrics like churn rate, retention rate, customer equitation cost, etc.
Speed and efficiency: Data teams also measure success by how quickly they are able to respond to data requests and deliver insights to the business. This includes metrics like data processing time, time to deliver data reports, and overall data analytics turnaround time.
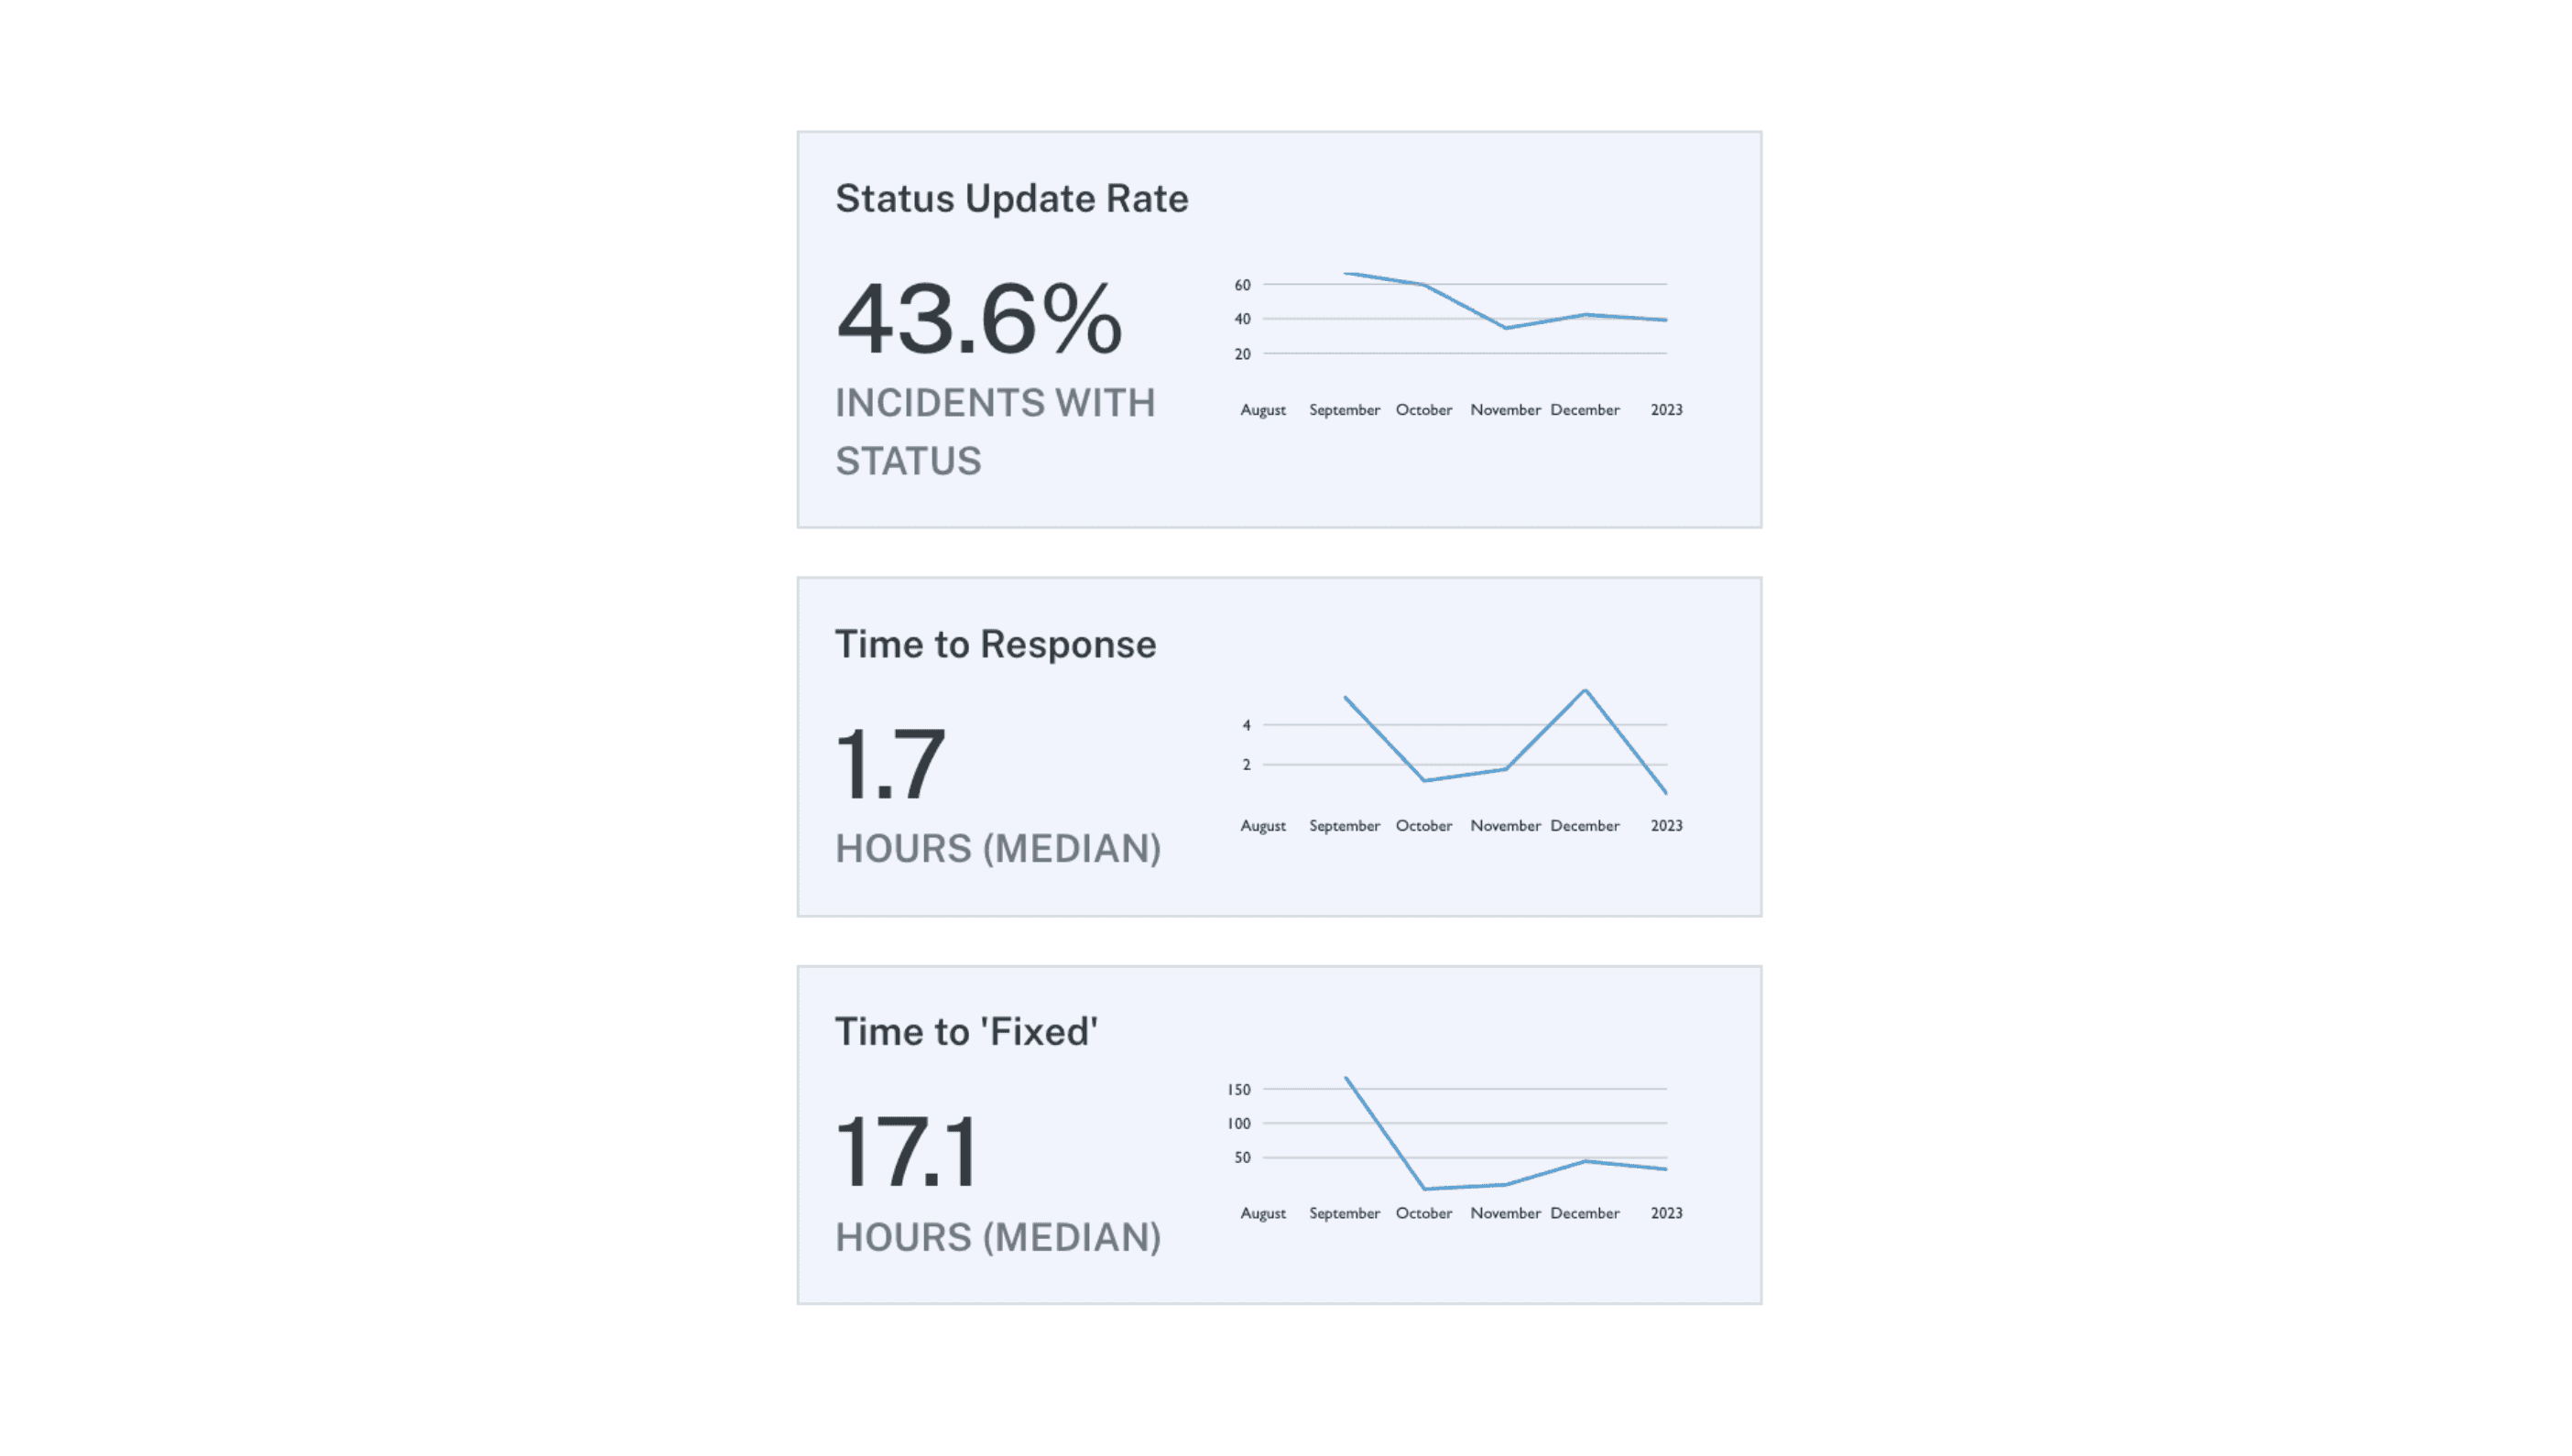
This monitoring graph helps us track how fast we respond to incidents and how fast we resolve them.
Team performance: Finally, data teams may measure their success by how well they are working as a team. This includes metrics like team morale, retention rates, and the ability to meet project deadlines. We haven't set up dashboards to track those metrics yet, but we plan to in the coming quarter.
I'm grateful to embark on this data journey with such a talented and dedicated team. I hope you all enjoyed this high-level overview of our approach to building a rocket ship data practice.
As we move forward, I encourage each and every team member to contribute their ideas and perspectives, and help us dive into every aspect of our data stack. Your hard work and expertise are invaluable to the success of our mission, and I look forward to continuing this journey with you all. If you have any questions or comments, please don't hesitate to reach out—together, we can make great things happen!
If you're interested in joining Drata, check out our open positions here.


Put Security & Compliance on Autopilot®
Close more sales and build trust faster while eliminating hundreds of hours of manual work to maintain compliance.