115 Compliance Statistics You Need To Know in 2025
Discover 115 essential compliance statistics for 2025, covering global trends, data security, third-party risk management, and more.
Working in the compliance space is a marathon, not a sprint. Each year, new regulations roll out for different frameworks and industries. For many businesses, keeping up with change isn’t only a question of money. Knowing what regulatory changes are coming and how they affect you is half the battle.
Across the globe, new rules and risks surrounding security compliance can vary. So, to help you stay on top of trends, we’ve compiled a list of the top 115 compliance statistics. We recommend taking it from the top, but you can also jump to a specific section below.
Compliance Trends for 2025
2025 presents new challenges and changes in the compliance field. Whether you want to get up to speed on trends from previous years or check the pulse on new IT security and compliance standards, keep these statistics in mind:
1. 91% of companies plan to implement continuous compliance in the next five years (Drata).
2. 87% of organizations report negative outcomes resulting from low compliance maturity or reactive compliance (Drata).
3. Three in four organizations with some degree of continuous compliance report their approach drives business. By contrast, 76% of companies that use point-in-time compliance argue the related effort poses a burden (Drata).
4. 40% of teams continually review compliance controls with automation. 55% of teams conduct reviews in manual intervals. The remaining 5% only perform reviews when it’s required or right before an audit (Drata).
5. 41% of businesses without continuous compliance report slowdowns on the sales cycle as a result (Drata).
6. 67% of companies with continuous compliance have larger teams. On the other hand, just 50% of teams using point-in-time have large teams (Drata).
7. 71% of organizations rate their compliance capabilities as excellent or very good. By contrast, just 29% rate theirs as good or fair, and 0% self-rated as poor (Drata).
8. 77% of organizations with continuous compliance indicate an excellent or very good compliance rating. However, only 67% following point-in-time practices rated their compliance program as highly (Drata).
9. 74% of organizations report they are not able to properly address vulnerabilities due to limited budgets and resources (Drata).
10. 74% of organizations state that compliance is a burden (Drata).
11. Environmental, social, and governance (ESG) initiatives are one of the lowest priorities for compliance teams, with just 18% of respondents noting it (NorthRow State of Compliance Trends Report 2023).
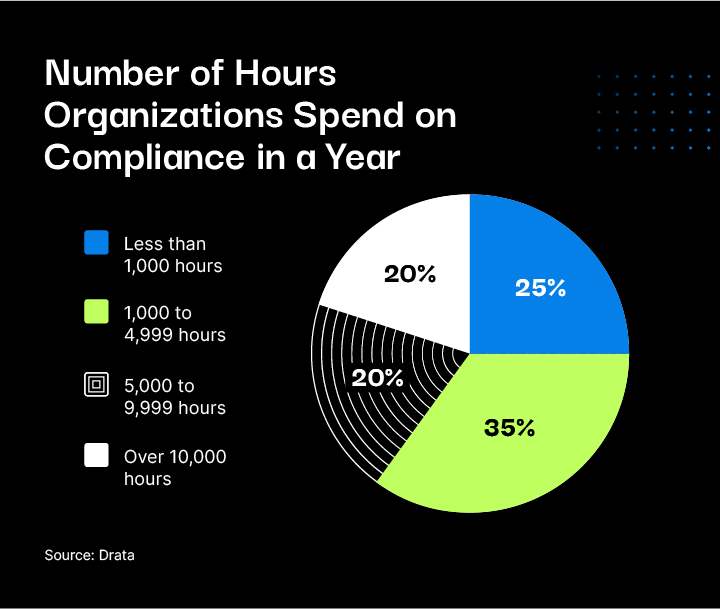
12. 25% of organizations spend less than 1,000 hours on compliance a year. 35% spend 1,000 to 4,999 hours, 20% spend 5,000 to 9,999 hours, and the last 20% spend over 10,000 hours on compliance a year (Drata).
13. One-third of anti-money laundering compliance teams face insufficient data coverage and accuracy issues (NorthRow State of Compliance Trends Report 2023).
14. One in five KYC (Know Your Customer) checks take more than 24 hours (NorthRow State of Compliance Trends Report 2023).
15. The average compliance onboarding success rate sits at 80% (NorthRow State of Compliance Trends Report 2023).
16. On average, 25% of business revenue is spent on compliance costs. 18% of businesses estimated that more than 50% of revenue is spent on compliance costs (NorthRow State of Compliance Trends Report 2023).
17. 40% of compliance teams use basic productivity tools such as word processors and spreadsheets to streamline and run processes (NorthRow State of Compliance Trends Report 2023).
18. 73% of leaders state that meeting compliance standards improves the perception of their business (NorthRow State of Compliance Trends Report 2023).
19. 41% of leaders state that training employees on compliance was a key focus for the year ahead. (NorthRow State of Compliance Trends Report 2024).
20. 46% of leaders cite the evolving regulatory landscape as a major threat. (NorthRow State of Compliance Trends Report 2024).
21. 95% of compliance staff have built or are building a culture of compliance to share the responsibility across their organization (Accenture’s Compliance Risk Study).
22. 93% of compliance teams agree that new technological advancements like artificial intelligence and cloud software makes compliance easier (Accenture’s Compliance Risk Study).
23. Only 16% of organizations have moved to the next frontier with the strategic navigation of risk as a core part of the compliance function despite the association between strategic risk navigation and company performance. (FloQast’s Exploring Strategic Compliance: The Next Frontier).
24. Almost half (47%) of compliance professionals reported that they were focused on finding an easier way to satisfy the legal requirements of compliance, while 37% focused on identifying and minimizing organizational risk. (FloQast’s Exploring Strategic Compliance: The Next Frontier).
25. 58% of compliance leaders saw internal costs associated with managing compliance efforts increase over the last three years. (Coalfire’s Securealities Report: 2023 Compliance).
26. 64% of large companies use enhanced evidence mapping to manage the impact of complying with multiple frameworks. (Coalfire’s Securealities Report: 2023 Compliance).
27. 77% of compliance leaders plan to transition to updated frameworks like PCI 4.0, NIST rev. 5, and others. (Coalfire’s Securealities Report: 2023 Compliance).
28. In 2023, almost 70% of service organizations claim the need to demonstrate compliance or conformity to at least six frameworks spanning information security and data privacy taxonomies. (Coalfire’s Securealities Report: 2023 Compliance).
29. 57% of organizations say preparing for technology investments is the single biggest motivating factor to review their risk landscape. (PwC’s Global Risk Survey 2023).
30. The average US firm spends between 1.3% and 3.3% of its total wage bill on regulatory compliance. This percentage is highest for firms with around 500 employees. (Cato Institute).
31. The main legal and compliance priorities for compliance and privacy leaders in 2024 were strengthening their personal impact on company strategy (42%), improving third-party risk management (40%), and ensuring compliance programs can keep pace with fast-moving regulatory requirements (39%). (Gartner).
32. Almost 90% of leaders are interested in the integration of AI tools by providers of risk and compliance solutions. (Moody’s Navigating the AI Landscape: Insights From Compliance And Risk Management Leaders).
33. 90% of early adopters report AI is positively impacting the work they do in risk and compliance. (Moody’s Navigating the AI Landscape: Insights From Compliance And Risk Management Leaders).
34. 89% of those in the fraud and compliance profession see AI as a “force for good.” (Thomson Reuters Future of Professionals Report).
35. Business executives say data protection/trust is their top cyber investment priority (48%), followed by tech modernization and optimization (43%). (PwC).
Global Compliance Statistics
Digital security and the global economy go hand in hand. No matter where you set up shop, international businesses must meet global standards. With that in mind, here are a few of the top global compliance statistics:
36. 83% of respondents to a European Banking Authority survey reported that they use AI, while 12% are developing and testing AI solutions (Thomson Reuters 10 Global Compliance Concerns for 2023).
37. 66% of global compliance teams in 2022 said they expected the cost of senior compliance staff to increase. 47% of this group claimed budget increases accommodated the demand for skilled staff and knowledge (Thomson Reuters 10 Global Compliance Concerns for 2023).
38. Russia’s invasion of Ukraine sparked an unprecedented round of sanctions causing anti-money laundering and know-your-customer departments to go into overdrive to comply with new requirements (Thomson Reuters 10 Global Compliance Concerns for 2023).
39. 90% of compliance professionals in the Philippines, Mexico, Thailand, Indonesia, China, and Vietnam claim that privacy regulation has a positive impact on their business (Cisco’s 2022 Data Privacy Benchmark Study).
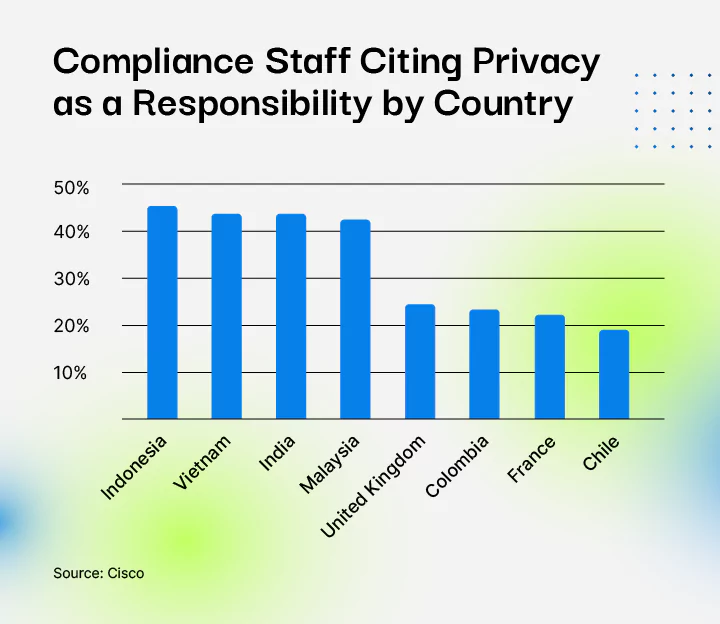
40. Asia-Pacific geographies had the highest percentage of compliance staff stating privacy was an area of responsibility. By country, the responses came out to: Indonesia (45%), Vietnam (43%), India (43%), and Malaysia (42%). The lowest percentages were in the U.K. (24%), Columbia (23%), France (22%), and Chile (19%) (Cisco’s 2022 Data Privacy Benchmark Study).
41. Leaders claim keeping up with global regulatory and political change tops the list of challenges for 2023 (NorthRow State of Compliance Trends Report 2023).
42. Beginning on January 1st, 2025, firms in the EU will need to comply with the EU's Digital Operational Resilience Act, which includes a common set of rules and standards to mitigate information, communication, and technology risk across the EU financial services sector by harmonizing fragmented rules and improving risk management. (Thomson Reuters 10 Global Compliance Concerns for 2024).
Data Security Compliance and Data Breach Statistics
Data breaches can pose a worst-case scenario for any business. Compromised data can lead to fines, lawsuits, and the loss of crucial information. To help wrap your head around cybersecurity compliance standards, here are a few takeaways:
43. The global average cost of a data breach in 2024 was $4.88 million—a 10% increase over 2023 and the highest total ever. (IBM Cost of a Data Breach Report 2024).
44. The average cost savings for organizations that used security AI and automation extensively in prevention was $2.2 million compared to those that didn’t. (IBM Cost of a Data Breach Report 2024).
45. US organizations spend an average of $78.5 million on cybersecurity (Ponemon Institute’s State of Cybersecurity and Third-Party Remote Access Risk).
46. 54% of organizations have experienced a cyberattack in the last year (Ponemon Institute’s State of Cybersecurity and Third-Party Remote Access Risk).
47. 40% of teams faced a security breach caused by blind spots resulting from manual compliance practices (Drata).
48. One-third of compliance teams cite cybersecurity as one of their top concerns for the year (NorthRow State of Compliance Trends Report 2023).
49. Finance and healthcare are the two top sectors at risk of cybersecurity attacks—58% of financial organizations and 55% of healthcare organizations reported a third-party data breach in the last year (Ponemon Institute’s State of Cybersecurity and Third-Party Remote Access Risk).
50. In the UK, half of businesses (50%) report having experienced some form of cybersecurity breach or attack in the last 12 months. This is much higher for medium businesses (70%) and large businesses (74%). (UK Government).
51. In the UK, the most common type of breach or attack is phishing (84% of businesses), followed by others impersonating organizations in emails or online (35% of businesses) and then viruses or other malware (17% of businesses). (UK Government).
52. 37% of organizations say they feel highly or extremely exposed to cyber risks in the next 12 months. (PwC’s Global Risk Survey 2023).
53. The number of organizations that maintain minimum viable cyber resilience is down 30%. (World Economic Forum Global Cybersecurity Outlook 2024).
54. 52% of public organizations state that a lack of resources and skills is their biggest challenge when designing for cyber resilience. (World Economic Forum Global Cybersecurity Outlook 2024).
55. While 88% of executives agree that measuring cyber risk is crucial for prioritizing investments, only 15% of organizations are actually doing it to a significant extent. (PwC).
56. 74% of all breaches include the human element, with people being involved either via error, privilege misuse, use of stolen credentials, or social engineering. (Verizon 2024 Data Breach Investigations Report).
57. The three primary ways in which attackers access an organization are stolen credentials, phishing, and exploitation of vulnerabilities. (Verizon 2024 Data Breach Investigations Report).
58. Nearly one-third of businesses reported having been victims of fraud or financial crime in the last five years. (NorthRow State of Compliance Trends Report 2024).
Cost of Non-Compliance Statistics
Ignoring compliance can be a costly mistake. To understand what's at stake, here are a few insights into the cost of non-compliance:
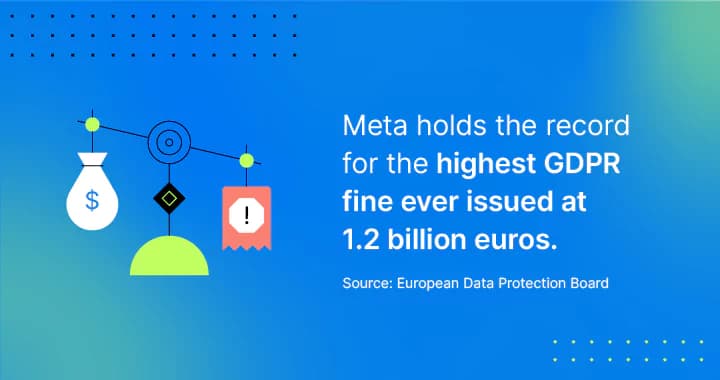
59. Meta owes the largest EDPB fine for non-compliant practices at 1.2 billion euros (European Data Protection Board).
60. Smaller companies with less than 5,000 employees rack up higher per capita compliance costs than larger businesses with 5,000+ employees (Globalscape: The True Cost of Compliance With Data Protection Regulations).
61. Indirect costs, such as administrative fees, make up 40% of compliance costs. Direct costs, such as payments to auditors, represent 32% (Globalscape: The True Cost of Compliance With Data Protection Regulations).
62. 47% of compliance professionals expect the cost of senior compliance staff to increase (Thomson Reuters Cost of Compliance 2021: Shaping the Future).
63. Nine in 10 business leaders think evolving business, regulatory, and customer demands will increase their compliance operating costs by up to 30% (Accenture).
64. 61% of compliance officers anticipate increased spending on their compliance processes in the next two years (Accenture’s Compliance Risk Study).
65. 54% of compliance staff believe artificial intelligence and machine learning will improve compliance at cut costs. However, many believe AI could become a source of disruption (Accenture’s Compliance Risk Study).
66. 40% of compliance teams plan to invest in new tech to achieve proactive, shared compliance responsibility (Accenture’s Compliance Risk Study).
67. 75% of the increase in average breach costs in 2024 was due to the cost of lost business and post-breach response activities. (IBM Cost of a Data Breach Report 2024).
Compliance Management Statistics
Compliance leaders have plenty of work on their plates. Executive decision-making can vastly affect business outcomes as much as compliance automation or new tools. From internal audits to chief compliance officers, here are some interesting things to note:
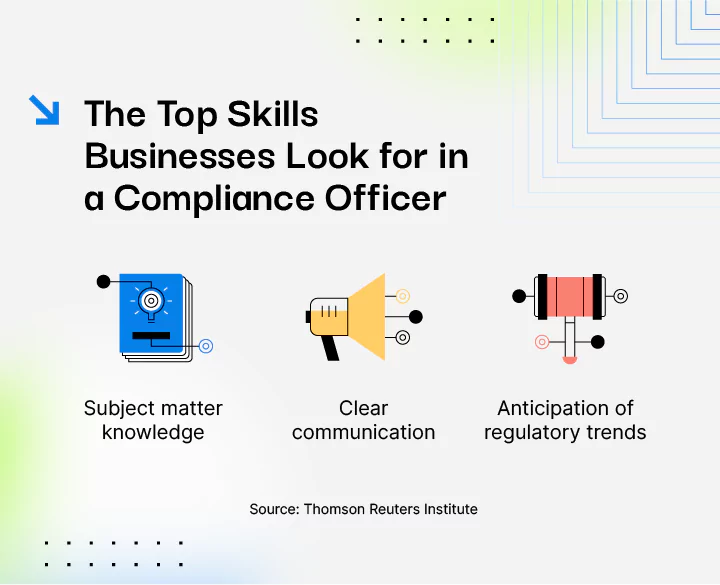
68. Businesses report the top skills for an ideal compliance officer are subject matter knowledge, clear communication, and anticipation of regulatory trends (Thomson Reuters: Cost of Compliance 2021: Shaping the Future).
69. Over 50,062 chief compliance officers work in the U.S. (Zippia).
70. Chief compliance officers in finance make more than others working the same role in other fields (Zippia).
71. Over half of compliance leaders say they use leading technologies to improve their compliance functions and staff performance (Accenture’s Compliance Risk Study).
72. 37% of businesses perform one or more internal compliance audits each year (Globalscape: The True Cost of Compliance With Data Protection Regulations).
73. 34% of businesses report that RegTech solutions affect how they approach compliance management (Thomson Reuters Report Cost of Compliance 2021: Shaping the Future).
74. 78% of companies report using data analytics for compliance risks. (White & Case’s 2023 Global Compliance Risk Benchmarking Survey).
75. Few companies (9%) consider themselves advanced in using data analytics for their compliance programs. Most companies (69%) report having a rudimentary or developing data analytics strategy. (White & Case’s 2023 Global Compliance Risk Benchmarking Survey).
76. 21% of companies with more than 50,000 employees report having fewer than 20 dedicated compliance staff. (White & Case’s 2023 Global Compliance Risk Benchmarking Survey).
77. 39% of compliance teams cite managing regulatory and political change as a major challenge. (NorthRow State of Compliance Trends Report 2024).
78. 38% of compliance leaders cite inefficient or manual compliance processes as their most significant worry. (NorthRow State of Compliance Trends Report 2024).
79. 21% of organizations said their compliance program rested within Legal, and 20% said it was an independent function reporting to the CEO and/or board of directors. (Navex 2024 State of Risk & Compliance Report).
80. 59% of security leaders indicate their organization has multiple systems that must adhere to compliance requirements. (Coalfire’s Securealities Report: 2023 Compliance).
81. 24% of organizations are using basic technology and data tools for risk management but lack comprehensive integration. (PcW).
82. 24% of organizations have established technology and data procedures for risk management, but they are not fully optimized. (PcW).
83. 60% of executives agree that cyber and privacy regulations effectively reduce risk in their organization’s ecosystem—up 21% since 2022. (World Economic Forum).
84. In 2023, respondents were more than twice as likely to report an increase in compliance budgets than a decrease (31% versus 13%). (White & Case’s 2023 Global Compliance Risk Benchmarking Survey).
85. 57% of leaders have prioritized enhancing compliance and due diligence training for team members in recent years. (NorthRow State of Compliance Trends Report 2024).
Third-Party Compliance Statistics
Compliance issues don’t begin and end with your own company. Third parties you work with can introduce their own compliance concerns. Here are a few key insights about third-party risk management statistics:
86. 58% of compliance teams report that gauging vendor responsiveness is their top challenge with third-party risk management (ACA’s Key Trends and Forces Shaping Risk and Compliance Management in 2021 Report).
87. 48% of organizations report difficulty with tracking third-party compliance (MetricStream State of Compliance Survey Report).
88. 48% of organizations lack a complete list of all third parties with access to their network (Ponemon Institute The State of Cybersecurity and Third-Party Remote Access Risk).
89. 39% of businesses listed vendor support issues as a primary reason for improving security frameworks (Ponemon Institute The State of Cybersecurity and Third-Party Remote Access Risk).
90. Cyberattacks targeting third parties have increased from 44% to 49% in the last year (Ponemon Institute The State of Cybersecurity and Third-Party Remote Access Risk).
91. In 34% of organizations, compliance departments oversee all third-party risk management themselves (Gartner).
92. 66% of legal and compliance leaders say third parties provide services outside their business’s core operational model (Gartner).
93. 73% of the effort devoted to risk identification is allocated to due diligence and recertification efforts. Meanwhile, only 27% of effort goes to identifying risks over the course of a relationship (Gartner).
94. 34% of organizations outsource at least some of their compliance functionality (Thomson Reuters Cost of Compliance 2021: Shaping the Future).
95. 52% of compliance experts claim a lack of data and information about partners exposes a business to third-party risks (Accenture’s Compliance Risk Study).
96. Only 69% of employees said their organization was at least “good” at engaging in ongoing monitoring and risk management throughout the course of a relationship with a third-party. (Navex 2024 State of Risk & Compliance Report).
97. 41% of the organizations that suffered a material incident in the past 12 months say it was caused by a third-party. (World Economic Forum Global Cybersecurity Outlook 2024).
98. 98% of organizations have a relationship with at least one third-party that has experienced a breach in the last two years. (SecurityScorecard Close Encounters of the Third (and Fourth) Party Kind).
99. Organizations that exhibit poor security posture have twice the number of third-party vendors and ten times the number of fourth parties. (SecurityScorecard Close Encounters of the Third (and Fourth) Party Kind).
100. More than half of organizations contractually require third-parties to cooperate with compliance inquiries. (White & Case’s 2023 Global Compliance Risk Benchmarking Survey).
101. 11% of employees reported they have been pressured to approve the engagement of a third-party presenting an unacceptable corruption risk. (White & Case’s 2023 Global Compliance Risk Benchmarking Survey).
Compliance Statistics by Framework
Each compliance framework introduces its own considerations and trends. To stay on top of changes across frameworks, we’ll cover some of the most popular ones.
HIPAA Compliance Statistics
For healthcare compliance information, check out these HIPAA compliance statistics:
102. In 2023, 725 data breaches were reported to OCR, and across those breaches, more than 133 million records were exposed or impermissibly disclosed. (The HIPAA Journal’s Healthcare Data Breach Statistics).
103. In 2023, OCR reported a 239% increase in hacking-related data breaches between January 1st, 2018, and September 30th, 2023, and a 278% increase in ransomware attacks over the same period. (The HIPAA Journal’s Healthcare Data Breach Statistics).
104. In the first quarter of 2023, 58% of ASETT (Administrative Simplification Enforcement and Testing Tool) complaints did not violate HIPAA rules (Centers for Medicare & Medicaid Services).
105. 2023 smashed all previous records with 133 million health records exposed, stolen, or otherwise impermissibly disclosed. The total for 2023 includes 26 data breaches of more than one million records and four breaches of more than eight million records. (The HIPAA Journal’s Healthcare Data Breach Statistics).
106. The largest data breach of 2023 affected over eleven million individuals, marking the second-largest healthcare data breach of all time. (The HIPAA Journal’s Healthcare Data Breach Statistics).
107. The largest healthcare data breach of all time occurred at Anthem Inc. in 2015, involving the records of 78.8 million individuals (The HIPAA Journal’s Healthcare Data Breach Statistics).
GDPR Compliance Statistics
With GDPR standards, countries in the EU can respond to digital security risks. Here are a few GDPR statistics to keep in mind:
108. The aggregate value of GDPR fines issued in 2022 was 50% more than the value of fines reported in 2021. (DLA Piper DLA Piper GDPR Fines and Data Breach Survey).
109. The aggregate total fines reported since the application of GDPR on May 25, 2018 to Jan. 10, 2023 now come out to 2.92 billion euros, or $3.1 billion (DLA Piper DLA Piper GDPR Fines and Data Breach Survey).
110. 90% of compliance workers view GDPR compliance as the hardest to attain (Globalscape The True Cost of Compliance With Data Protection Regulations).
Additional Compliance Framework Statistics
Payment data security and international compliance standardization grow more important by the year. Below are a few takeaways on the state of compliance for the Payment Card Industry Data Security Standard (PCI DSS) and ISO 27001:
111. In the U.S., PCI fines can range from $5,000 to $100,000 per month until the issue is resolved (VikingCloud).
112. Organizations achieving full PCI compliance reached 43.4% in 2020. In 2023, it decreased to 14.3%. (Verizon’s 2024 Payment Security Report).
113. When measured across the PCI DSS, the overall control gap remained consistently below 10%. (Verizon’s 2024 Payment Security Report).
114. The ISO has implemented 25,729 international compliance standards (ISO).
115. 173 countries have ISO members representing them (ISO).
How Drata Can Help You Achieve and Maintain Compliance
Maintaining compliance can be a time-consuming and difficult task. It also requires you to keep an ear to the ground to learn about framework updates and new regulations before they impact your business.
If you’re having trouble achieving compliance, Drata can help. Our tool automates your compliance processes, ensuring you’re audit-ready no matter what compliance framework you need to adhere to. Our flexible platform applies to different frameworks and industries. With a few clicks, you can put compliance on autopilot to focus on the service your customers love.
Schedule a demo with our team to learn more today.